From the Reports tab, go to the Salesperson Performance section.
Click Average
Response.

The Average Response Time report displays the time between the receipt of an email lead from a prospect and the response to it from a salesperson. It does not include an Auto-Response as a response from a salesperson, and the data that displays in the report is current through the previous day.
From the Reports tab, go to the Salesperson Performance section.
Click Average
Response.
|
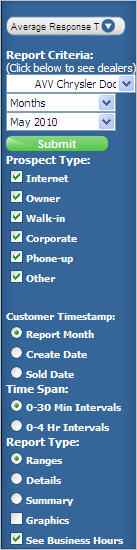
When the Average Response Time report initially displays, the current month's data is shown in the Ranges view, and the dealership's business hours are considered in the report calculations. You can change the report criteria so you can see different time periods, prospect types, customer timestamps, time spans, and report types. In the Report Criteria section, you can select:
In the Prospect type section, you can select one or more types including:
In the Customer Timestamp section, you can select:
In the Time Span section, you can select (for the Ranges view only):
In the Report Type section, you can select:
Other Options: Graphics - Allows you to see a graphical representation of the data See Business Hours - Uses dealership's business hours when calculating response times
|
|
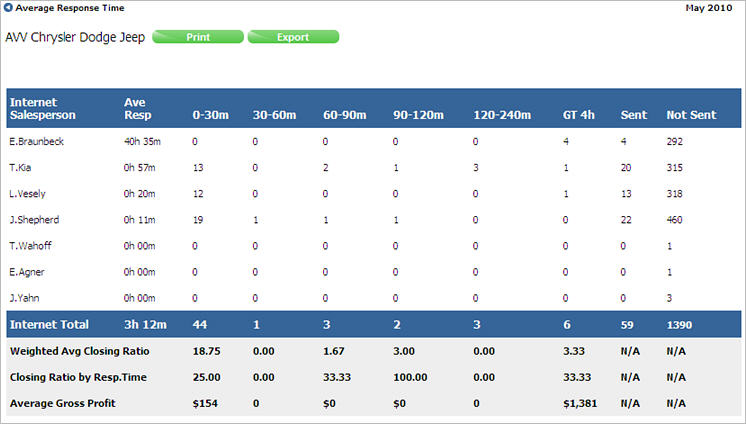
The Range view of the report displays the data organized by salesperson, average response time, and number of responses in a range (i.e. 30-60 min) for each prospect type. Additionally, the Range view displays information on the following:
Weighted Average Closing Ratio: The purpose of using a weighted average is to distribute the closing ratio more accurately based on the number of responses in a particular time period. Here is an example:
In the 0-30 minute range for a month, if 100 customers were responded to and 50 were sold, the closing ratio without any weighting would be 50%. In the 120-240 minute range for the same month, if two customers were responded to and sold, the closing ratio without weighting would be 100%. To give a more accurate view, weighted averages are given to each range, and ranges with more respondents are given more weight. Therefore the 0-30 minute range would have a higher weight than the 120-240 minute range.
Closing Ratio by Response Time: This ratio is displayed without any weight given to the range. As seen in the example for Weighted Average Closing Ratio, the ratio without weighting would be 50% for the 0-30 minute range, and 100% for the 120-240 minute range.
Average Gross Profit: This value represents the average gross profit made from prospects sold in a particular range. Using the example for Weighted Average Closing ratio where two prospects were sold for 120-240 minute range. If one customer had a gross profit of $1,000, and the other customer had a gross profit $1,500, then the average gross profit for the two customers sold would be $1,250.
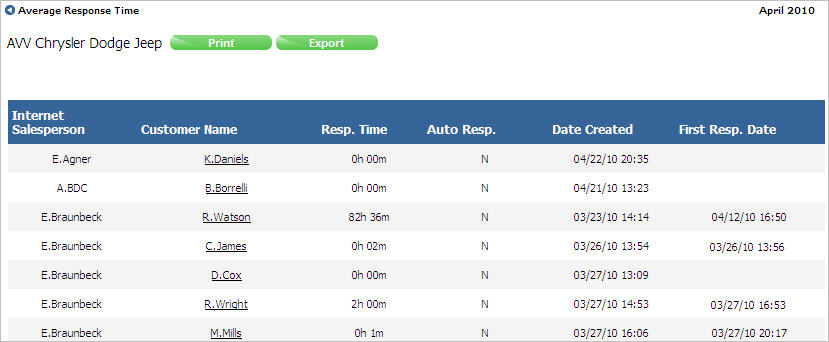
The Details view of the report displays the data organized by salesperson, prospect, response time, auto-response (Yes/No), date created and first response date/time.
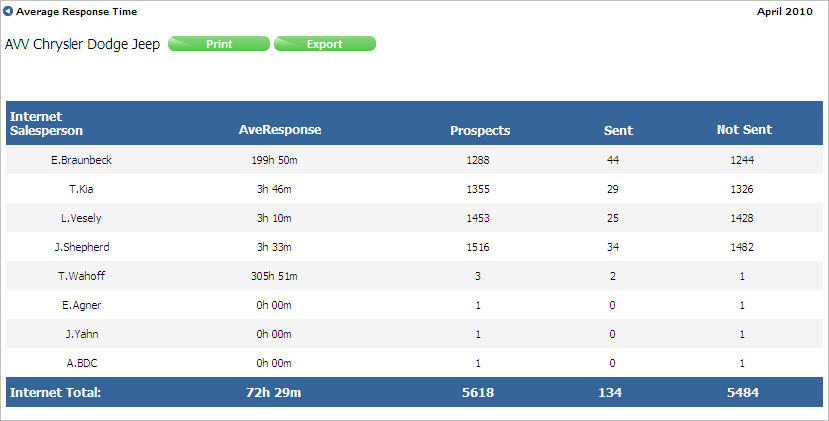
The Summary view of the report displays the data organized by salesperson, average response time for all prospects in time period selected, number of prospects who received a response, and number of prospects who did not receive a response.
Revised: June 2010