The Lead Source Performance report consists of two graphs and several columns of data. Additionally, icons that display in the report can help you view it in different ways. Click the following links for more information on reading the report:
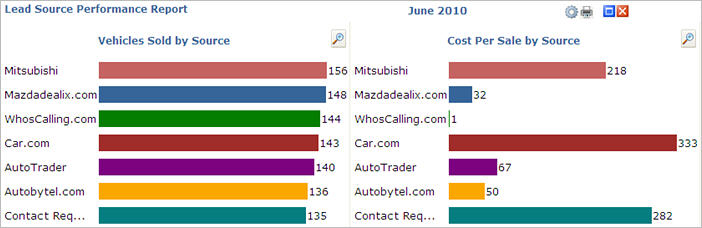
The Lead Source Performance report displays two graphs. One graph, Vehicles Sold by Source, displays the number of vehicles sold from a particular source and the other graph, Cost Per Sale by Source, displays the cost per sale. The sources listed when the graph initially displays are the top seven sources based on vehicle sales for the month.
|
Important Note: The first time you display the report or sub-reports, you may be prompted to download Microsoft® Silverlight™ software. After you download the software, please close and reopen the report by clicking the Report tab and then clicking the Lead Source Performance report link again.
|
|
|
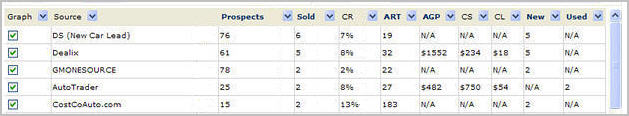
The Lead Source Performance report graphs data on selected sources. The initial sources that display are the top seven sources for vehicles sold. In the Graph column, you can select other sources, up to a maximum of seven, to display on the Vehicles Sold by Source and Cost per Sale by Source. The sources you choose for the Lead Source Performance report are also used for the sub-reports. |
|
Tip! Place your mouse pointer over the column header to see the meaning of any abbreviations or for any special notes about the column information. |
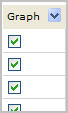
Graph – The Graph column displays check boxes for you to select sources. The selected sources appear in the graphs. You can select up to seven sources to graph at any one time.
Source – The Source column displays all sources for the dealership. Any source listed in your Web Control Settings displays in this column. Go to the Settings section to see the list of sources and to add your own dealer-defined sources.
Prospects – The Prospects column displays the total number of prospects from a particular source for the time period selected. Click the Prospects column header to display a sub-report where additional details on the source’s prospects are available. [More information on Prospects sub-report]
Sold – The Sold column displays the total number of sold prospects from a particular source for the time period selected. Click the Sold column header to display a sub-report where additional details on the source’s sold prospects are available. [More information on the Sold sub-report]
CR – The CR (Closing Ratio) column displays the closing ratio for a particular source for the time period selected. The Closing Ratio is determined by dividing the number of cars sold from a source by the number of leads received from the same source.
ART – The ART (Average Response Time) column displays the average time in minutes for responses to a prospect from a particular source. Click the ART column header to display a sub-report where additional details on the average response time for a source’s prospects are available. [More info on the ART sub-report]
AGP – The AGP (Average Gross Profit per Sale) column displays the average gross profit for sales from a particular source. Information displays in this column only if you have Web Control’s DMS Data Retrieval program. Click the AGP column header to display a sub-report where additional details on the average gross profit per sale for vehicles sold from a source are available. [More information on the AGP sub-report]
CS – The CS (Cost per Sale) column displays what the lead cost is for vehicles sold from a particular source. To determine the lead cost per sale, the number of leads from a source is multiplied by the cost per lead for the same source. Then the total is divided by the number of cars sold from the source. Here is an example. In a particular month, you receive 100 leads from a source that charges $20 per lead. In that same month, you sell 10 cars from that source. Your cost per sale is $200, which is (100 x $20)/10.
CL – The CL (Cost per Lead) column displays the lead costs you enter for your sources. You can enter lead costs for sources in the Add/Edit Sources section in the Settings section.
New – The New column displays the number of new cars sold from a particular source. Click the New column header to display a sub-report where additional details on the source’s sold prospects are available. This sub-report is the same as the Sold sub-report, but this version initially displays only new cars sold. [More information on the New sub-report]
Used – The Used column displays the number of used cars sold from a particular source. Click the Used column header to display a sub-report where additional details on the source’s sold prospects are available. This sub-report is the same as the Sold sub-report, but this version initially displays only used cars sold. [More information on the Used sub-report]
|
|
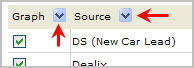
You can sort the Lead Source Performance report and the sub-reports in ascending and descending order using the arrows next to the column headers. |
|
|
In the top right corner of the Lead Source Performance report and the
sub-reports are a group of icons. The
blue Maximize/Minimize button ( |
|
|
If you click the magnifying glass ( |
|
|
To close the Lead Source Performance report or any of the sub-reports,
click the Close icon ( When you close the Lead Source Performance report, you return to the Report Summaries page. If you close one of the sub-reports, you return to the Lead Source Performance report. |
Revised: June 2010

 ) allows you to view the report
with or without the left navigation pane.
) allows you to view the report
with or without the left navigation pane.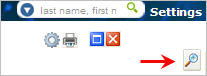
 ) that is located
in the top, right-hand corner of the graph, a larger version of the graph
displays. Note,
the column information does not display in this view.
) that is located
in the top, right-hand corner of the graph, a larger version of the graph
displays. Note,
the column information does not display in this view.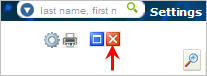
 ) in the top, right-hand corner of
the screen.
) in the top, right-hand corner of
the screen.